
OOH Attribution Data Is Probably Wrong
I got a call last quarter from an operator in Atlanta. He'd lost a deal to a cheaper competitor, and his client had sent him a printout of an attribution report showing the competitor's billboards had driven a 340% return on ad spend. The competitor had printed it. The client believed it. My guy was left trying to explain why his own attribution data said something different.
I told him: don't. Don't fight data with data. That battle is always ugly and usually unwinnable, because the underlying numbers are messier than anyone in the room wants to admit.
Here's what I know from four years in marketing analytics before I moved into OOH: attribution data in this medium is useful directionally. It is not a precision instrument. The sooner operators accept that, the better they'll be at having honest conversations with buyers about what measurement can and cannot prove.
This post is about why OOH attribution is hard, where the numbers tend to go sideways, and what you can actually use to defend your inventory without overpromising on data you can't deliver.
The Two Problems OOH Attribution Is Actually Trying to Solve
When buyers ask for attribution data, they're asking for two different things and usually not realizing it.
The first problem is reach and frequency. How many different people saw the billboard, how many times, and what's the likelihood they actually noticed it? This sounds straightforward but it isn't, because reach requires knowing the actual audience composition of the traffic passing the board, not just the raw vehicle count. That number changes depending on who you ask and what model they used.
The second problem is business outcome. Did the billboard actually cause people to visit the store, search for the brand, or buy something? This is a causal question. It is fundamentally harder than a measurement question, and no attribution tool in existence fully solves it. Which I'm only half joking about, except I'm not.
Most operators conflate the two. They use reach and frequency data to make causal claims about business outcomes. That math doesn't work, and buyers who have analytics teams know it. That's the part that keeps me up at night, talking to operators who are sending attribution reports that are technically defensible but substantively misleading.
The Panel Weighting Problem Nobody Talks About
Here's the thing about circulation data. The number on your rate card — the daily effective circulation, or DEC — was generated by someone using a specific methodology. That methodology is not standardized across the industry, and this is a problem nobody in the sales conversation ever mentions.
Lamar uses Geopath. Outfront uses Geopath plus proprietary adjustments. Clear Channel has its own circulation model. Regional operators often use state DOT traffic counts, which measure vehicles, not people, and then apply a per-vehicle occupancy factor that varies by market, sometimes within a range of 1.5 to 2.5 passengers per vehicle depending on whether it's a commuter corridor or a weekend shopping route.
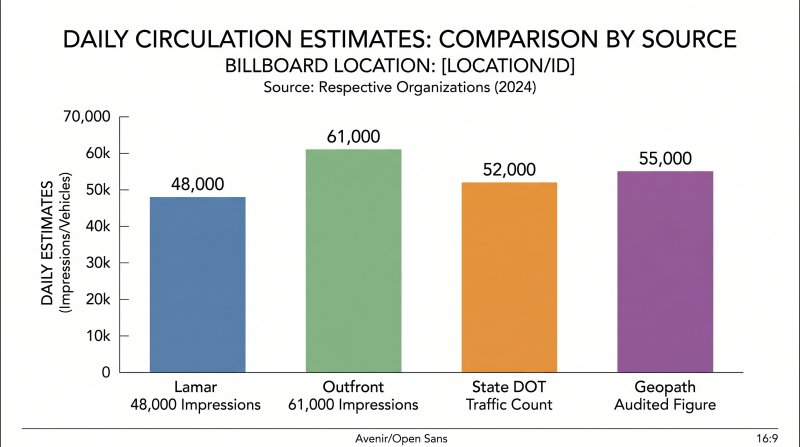
When I was building attribution models at my last company, I spent three weeks trying to reconcile campaign data across five operators. The same location in a Dallas submarket had three different circulation estimates. One operator said 48,000 daily impressions. Another said 61,000. The actual daily traffic count from the Texas DOT was 52,000 vehicles. None of them was wrong exactly. They were just using different models to translate vehicles into people.
This matters because CPM is calculated from impression data. If your impression count is inflated by 20% relative to a competitor's methodology, your effective CPM is 20% higher than it looks. A buyer comparing your CPM to a competitor's CPM might be comparing two numbers built on completely different foundations. It's like one person measuring a room in square feet and another in square meters, then being confused about why the same room costs different amounts.
Which number do you use? There's no industry standard. That's the honest answer. The OAAA has been pushing for methodology transparency for years, and it hasn't happened yet. I've sat in rooms where operators from the same market were quoting the same board at CPMs that differed by 30%, and neither of them knew it. That's the state of standardization in this industry.
Why Your Impression Numbers Are Probably Inflated
Beyond the weighting problem, there's a separate issue that comes up constantly in my work: the numbers on your rate card may be based on outdated traffic data.
Circulation studies are expensive. A proper Geopath study for a single location runs thousands of dollars. Most operators commission new studies every three to five years, or when an RFP specifically demands updated documentation. In fast-growth markets — Austin, Phoenix, parts of Florida — traffic patterns can shift significantly in 18 months. New housing developments change commuter routes. Highway construction diverts traffic. A location that was sitting at 60,000 vehicles daily in 2021 might be sitting at 45,000 now, if a bypass took effect. Which happens more often than operators admit.
The rate card didn't update. The buyer is still quoting 60,000. And when the attribution data comes back showing low store visit lift, everyone blames the creative or the location, when the real problem is that the audience estimate was stale before the campaign started.
I worked with a regional QSR brand that was convinced their billboards in a Phoenix submarket were their worst-performing locations. Their attribution tool showed low store visit lift. When we pulled the actual traffic count data from ADOT, the Arizona Department of Transportation, we found the board was sitting in a construction zone that had reduced daily traffic by 38% for 14 months. The circulation figure in the operator's system was from 2022. The board hadn't changed. The audience had.
That changes the conversation completely. You're not looking at a failing location. You're looking at a location with a temporarily reduced audience and a rate card that doesn't reflect reality. The fix is a rate reduction or a different board, not a reflection on OOH as a channel.
This is what I call the ghost audience problem. The board shows a number. That number was real once. It is not real now. And until someone pulls the actual DOT data or commissions a fresh study, nobody knows by how much.
What Actually Works: The Measurement Stack Worth Using
So what should you actually be using to defend your inventory? Here's my honest framework, built from four years of building these models and watching what holds up under buyer scrutiny.
The first thing is match-market testing. The idea: run your campaign in a test market and a comparable holdout market, then measure the difference in brand metrics or store traffic between them. This is how controlled experiments work, and it is the cleanest way to establish causal impact that I've found in practice.
Nielsen ran a study for a major convenience store chain in 2023 using a matched-market approach. They found a 23% lift in unaided awareness in markets where the OOH campaign ran, versus the holdout markets. That's a real number from a real study with a real control group. It's also the kind of data that survives buyer scrutiny because the methodology is defensible. The operator can hand that to a client and the client's analytics team can't pick it apart without challenging Nielsen's experimental design, which most analytics teams won't do.
The limitation: you need at least two comparable markets, and you need enough time and budget to run the test properly. This works best for brands with regional or national footprints, not single-market operators. If you're an independent in a tertiary market running a six-week campaign, match-market testing isn't going to happen.
The second tool is platform attribution. Google, Facebook, and other large platforms have run controlled experiments measuring OOH's contribution to store visits. Google's ARO, the Advertising Research Office, published data in 2024 showing that OOH contributed to a statistically significant lift in store visits for the campaigns they studied, ranging from 4% to 7% depending on market density and campaign design.
This data is valuable because it's from a platform with the scale to run controlled experiments. It's not operator-reported. It's not based on circulation estimates. It's based on actual observed behavior changes correlated with OOH exposure windows, which is a different methodology than what most attribution tools use.
I've used this data with clients who were skeptical about OOH attribution, and it reframed the conversation. Instead of arguing about whether OOH drove a 340% ROAS, we were looking at what OOH demonstrably contributed to the overall purchase funnel. The number is smaller. It is also honest. The buyers I've worked with have consistently told me they prefer a small honest number over a large one they can't defend.
The limitation: this data is available primarily for brands running digital attribution through Google's ecosystem. Not every buyer has access to it. Smaller regional brands may not have the Google infrastructure to show up in ARO studies.
The third tool is geo experimentation, which is more accessible for mid-size operators. The concept is simple: pick a test market and a comparable holdout, run the campaign in the test market, and measure the difference in sales, traffic, or brand metrics. In practice it requires some statistical discipline, and I won't pretend otherwise. You need to define your holdout properly, control for confounds like local events or competitive activity, and have enough data points to establish significance. None of this is complicated if you've done it before. It is complicated if you haven't.
For operators with clients in two or three markets, this can produce surprisingly clean results. I've seen it work well for seasonal campaigns where the test and holdout markets have similar baseline curves. The key is being honest about the limitations in the report you send, rather than letting the buyer assume more precision than you actually have.
The fourth tool is honest attribution stacking. This is a framework more than a data source. The idea is to layer multiple measurement approaches and present them together, with appropriate caveats, rather than relying on any single attribution number. Which is what most operators do, because a single number is easier to present. But it's also easier to attack.
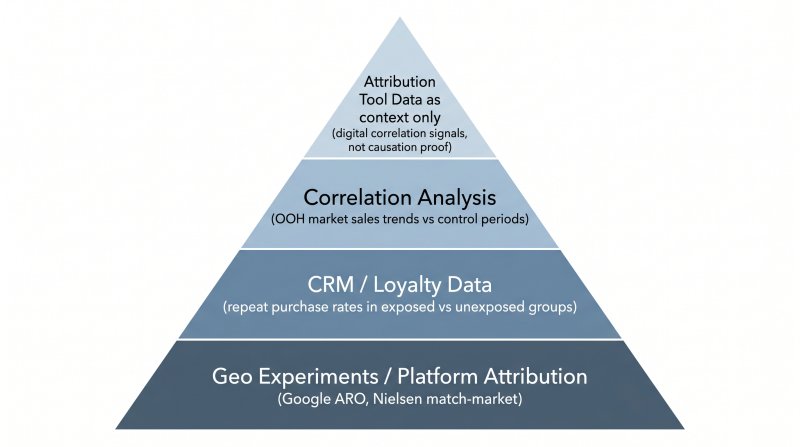
A practical attribution stack for an OOH campaign might look like this. At the foundation, you have geo experiment results or platform attribution data, if available. Above that, you layer in CRM or loyalty data, if the client has it, to show whether repeat purchase rates differ between exposed and unexposed customer groups. Then you add correlation analysis: do sales in the OOH markets trend differently during the campaign window compared to the same period last year, or compared to non-OOH markets? Finally, attribution tool data goes in as context, not proof. It tells you whether people who were exposed to the OOH campaign also engaged with the brand digitally. It does not tell you whether the billboard caused anything.
The attribution tool number is the weakest link in that stack. That is not a knock on the technology. It is a reflection of the fundamental difficulty of isolating OOH's contribution in a multi-touch world where a customer might see your billboard, then Google you on their phone, then visit the store three days later after seeing a retargeting ad. Any attribution tool that claims to do that precisely is overstating what the methodology can support. They tend not to put that caveat in the report they send you.
How to Have an Honest Conversation With Your Buyers About Measurement
This is the part I think operators avoid because it feels like conceding ground. It isn't. It is where trust gets built, and it is the difference between operators who keep clients for years and operators who lose deals to competitors who were cheaper, not better.
Here's the script I use, and the principle behind it. The principle is: tell them what the data can and cannot show, before they find out the hard way and lose confidence in everything you've said.
When a buyer asks for attribution data, I say something like: "The attribution data we'll share with you is directionally useful. It's based on circulation estimates and digital correlation signals, which means it's estimating exposure rather than proving causation. What it can show you is whether people who were exposed to the campaign engaged with the brand digitally. What it can't definitively show is whether the billboard caused a store visit or a purchase. For that, we'd recommend a matched-market test if your scale allows, or we can walk you through the Google ARO data on OOH's contribution to store visits in comparable campaigns."
That conversation takes two minutes. It preempts the moment where a buyer's analytics team pokes holes in your attribution report and makes you look like you were overselling. It also positions you as someone who knows the methodology well enough to be honest about its limits, which is not what buyers expect from most operators, and that contrast works in your favor.
The operators I've seen keep clients long-term are the ones who do not oversell attribution data. They use it as one input in a broader story about brand building and market presence. They can point to match-market test results or geo experiments when the situation calls for it, and they can explain why the attribution tool number is directional rather than definitive. They also do not lead with attribution data when the buyer hasn't asked for it. If a buyer is asking about measurement, give them the full framework. If they're asking about inventory and pricing, do not volunteer a 340% ROAS claim from an attribution tool that can't support it.
If you've been building your proposals the way most operators do — rate card, demographic data, a section on audience delivery — then attribution is the part of the conversation you might be skipping. AdGrid's proposal tools help operators structure proposals that address buyer questions before they become objections, including how to present measurement context honestly.
Buyers do not expect OOH to be perfectly measurable. They expect operators to know what they're talking about. That second part is underrated.
FAQ
Why is OOH attribution harder than digital attribution?
Digital attribution has deterministic data — you know exactly who clicked an ad because they did something trackable. OOH has no direct response signal. You're estimating how many people saw a board based on traffic counts and audience models, then trying to prove that estimate caused a business outcome. The gap between measurement and causation is much wider in OOH than in digital, and no attribution tool fully closes it.
What should billboard operators actually be using for measurement?
Match-market testing, platform attribution data from Google or Facebook, and geo experimentation are the three methods that hold up under buyer scrutiny. Attribution tool data is useful as directional context but should not be presented as proof of causation. The operators who communicate measurement honestly are the ones who keep clients long-term.
Why do different operators quote different CPMs for the same location?
Because they use different circulation methodologies. Lamar, Outfront, Clear Channel, and regional operators all use different models to translate vehicle traffic into people impressions. Until there's an industry standard for how that calculation is done, the same location can have meaningfully different impression estimates depending on who generated the number.
What is a matched-market test for OOH?
A matched-market test runs your OOH campaign in a test market while holding out a comparable market as a control. You then measure the difference in brand metrics, store traffic, or sales between the two markets. The difference is attributed to OOH. This is the cleanest causal measurement available for out-of-home, and it's the methodology used by Nielsen and platforms like Google ARO to establish OOH's contribution to business outcomes.
How do I tell a buyer their attribution data is directional, not definitive?
Be direct and brief. Tell them the attribution data you're sharing estimates exposure through digital correlation, but cannot definitively prove the billboard caused a purchase or store visit. Offer to walk them through a matched-market test or the Google ARO study on OOH's store visit contribution. Buyers respect honesty about methodology more than confidence in numbers that can't survive scrutiny.
Last updated: April 25, 2026
About Sara Lindqvist
Sara Lindqvist leads measurement and attribution strategy at AdGrid. Before joining the team, she spent four years in marketing analytics at a regional CPG company, where she built the attribution models used to evaluate OOH and digital media mixes for brands across the Southeast. She moved into OOH specifically because she believed the medium was undervalued by data, and wanted to close the gap between what operators could prove and what their inventory was actually worth.
Sara Lindqvist leads measurement and attribution strategy at AdGrid. Before joining the team, she spent four years in marketing analytics at a regional CPG company, where she built the attribution models used to evaluate OOH and digital media mixes for brands across the Southeast. She moved into OOH specifically because she believed the medium was undervalued by data, and wanted to close the gap between what operators could prove and what their inventory was actually worth.
Ready to Modernize Your OOH Operations?
Join the leading OOH media owners who use AdGrid to automate their quoting, manage inventory, and grow their revenue.